
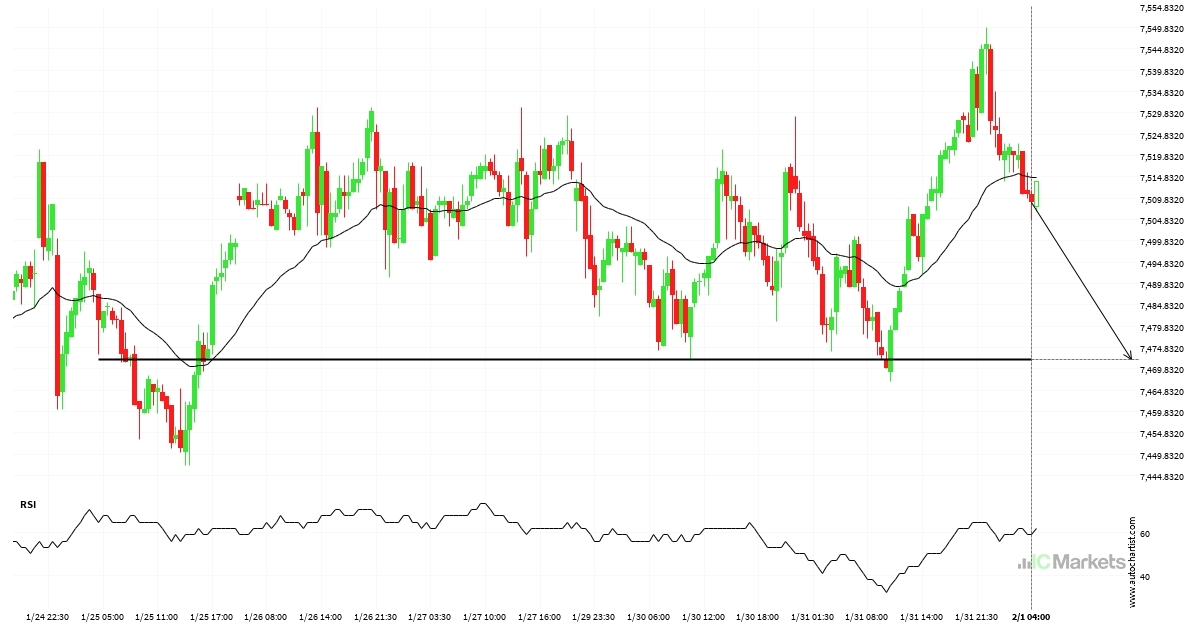
A final push possible on Australia 200 Index
Australia 200 Index is heading towards 7472.1099 and could reach this point within the next 2 days. It has tested this line numerous times in the past, and this time could be no different, ending in a rebound instead of a breakout. If the breakout doesn’t happen, we could see a retracement back down to […]
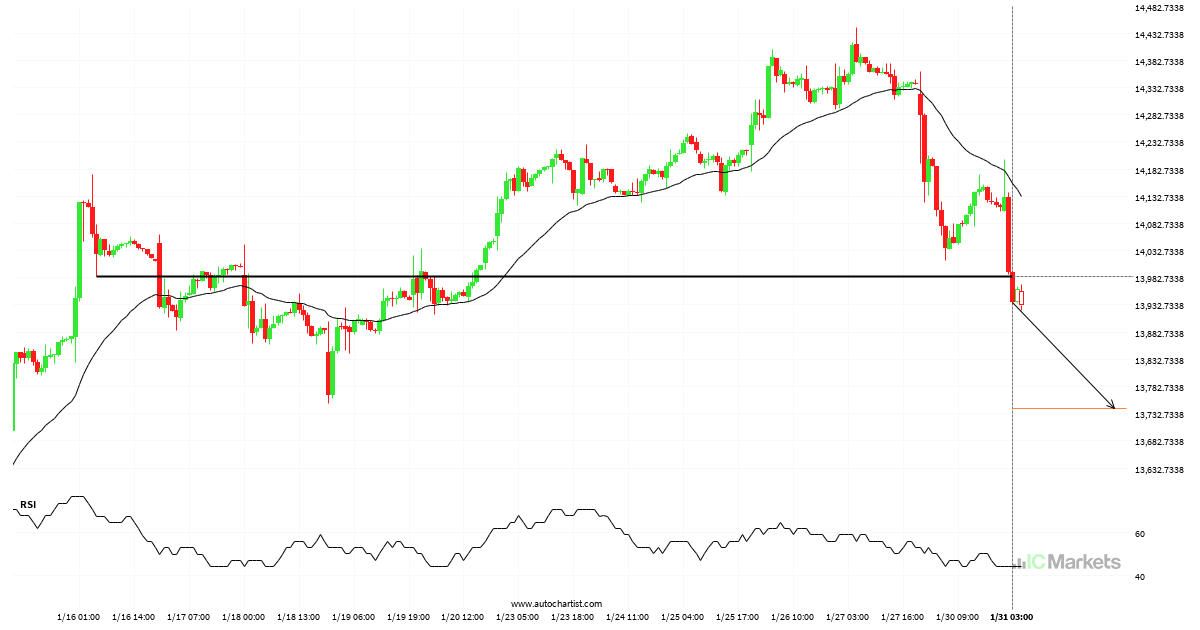
Important price line breached by FTSE China A50 Index
FTSE China A50 Index has broken through 13985.0703 which it has tested numerous times in the past. We have seen it retrace from this price in the past. If this new trend persists, FTSE China A50 Index may be heading towards 13741.5566 within the next 3 days.
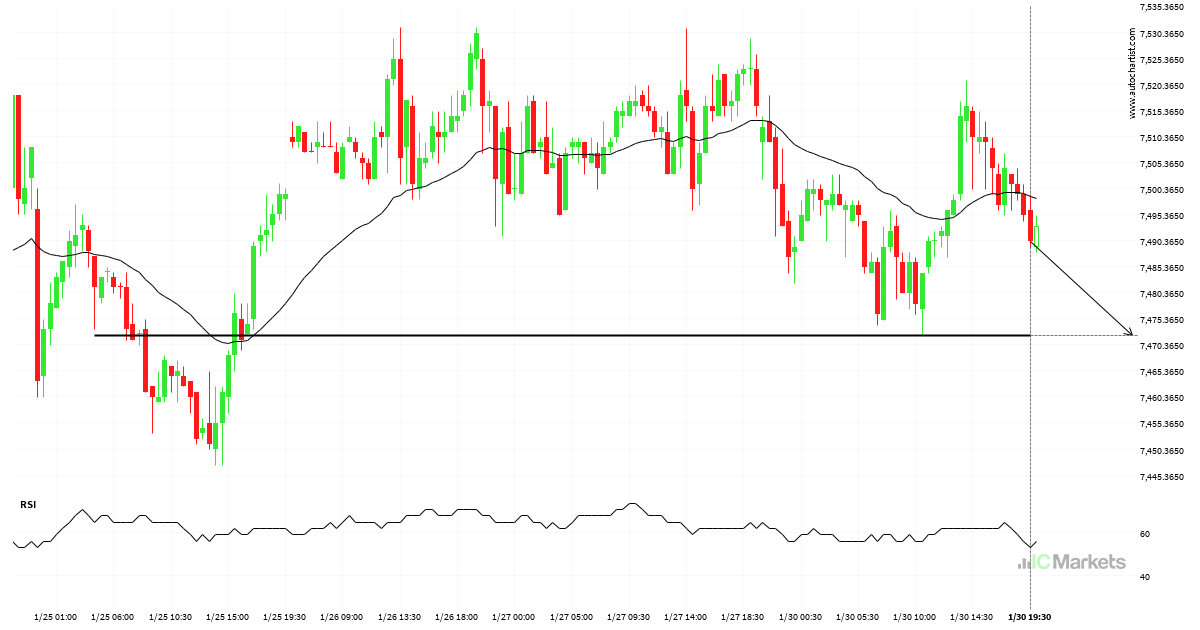
Either a rebound or a breakout imminent on Australia 200 Index
Australia 200 Index is heading towards a line of 7472.1099. If this movement continues, the price of Australia 200 Index could test 7472.1099 within the next 17 hours. But don’t be so quick to trade, it has tested this line numerous times in the past, so this movement could be short-lived and end up rebounding.
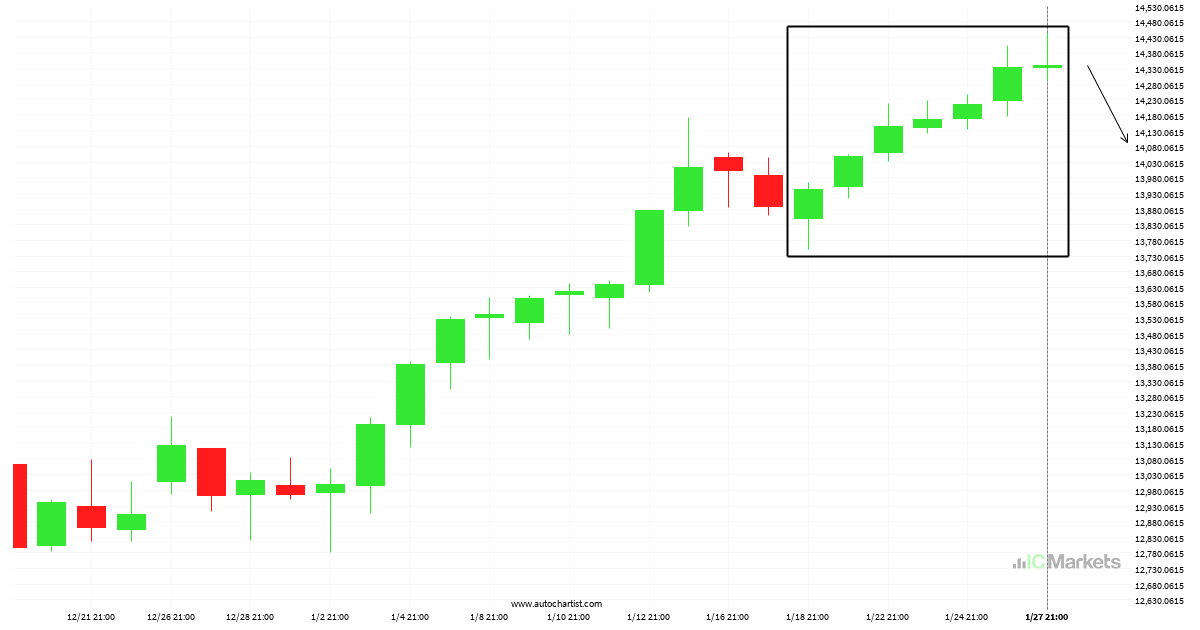
7 consecutive daily bullish candles on FTSE China A50 Index
FTSE China A50 Index has moved higher after 7 consecutive daily candles from 13845.6000 to 14338.3100 in the last 10 days.
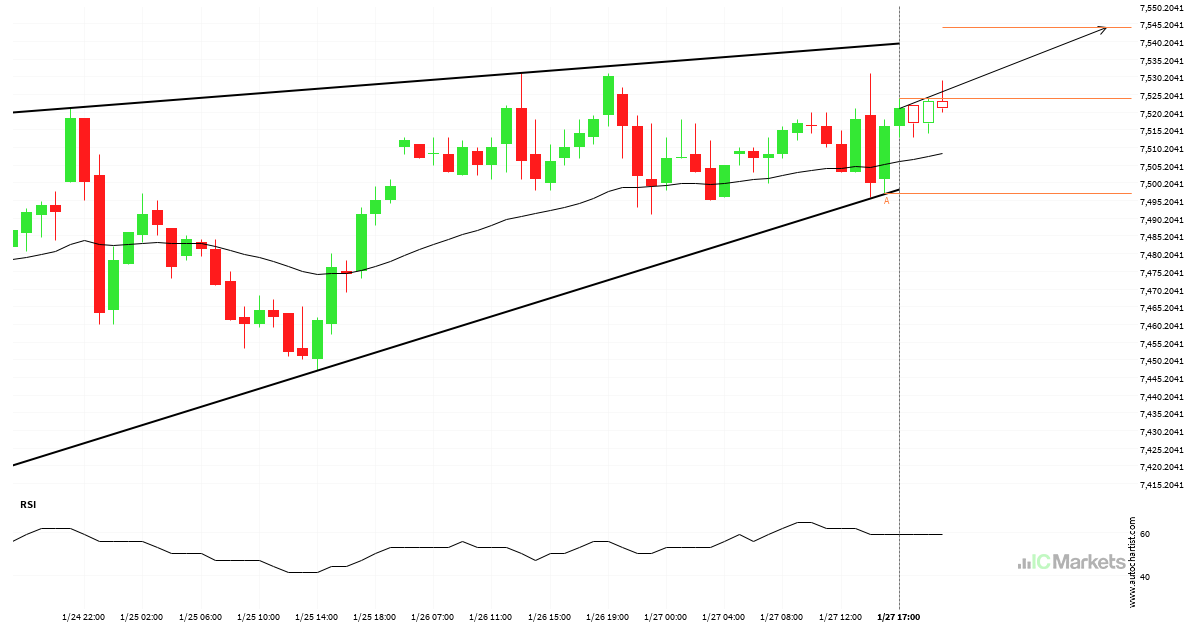
Either a rebound or a breakout imminent on Australia 200 Index
Australia 200 Index is heading towards the resistance line of a Rising Wedge. If this movement continues, the price of Australia 200 Index could test 7544.0240 within the next 15 hours. It has tested this line numerous times in the past, so this movement could be short-lived and end up rebounding just like it did […]

What’s going on with FTSE China A50 Index?
Trend followers are probably eagerly watching FTSE China A50 Index to see if its latest 6 consecutive candles continues. If not, the mean-reversion people out there will be delighted with this exceptionally large 9 day move.

Either a rebound or a breakout imminent on Australia 200 Index
Australia 200 Index is heading towards the resistance line of a Channel Up. If this movement continues, the price of Australia 200 Index could test 7573.6611 within the next 2 days. It has tested this line numerous times in the past, so this movement could be short-lived and end up rebounding just like it did […]

Australia 200 Index approaching resistance of a Rising Wedge
Australia 200 Index is approaching the resistance line of a Rising Wedge. It has touched this line numerous times in the last 7 days. If it tests this line again, it should do so in the next 2 days.

Will Australia 200 Index have enough momentum to break resistance?
Australia 200 Index is heading towards the resistance line of a Rising Wedge and could reach this point within the next 2 days. It has tested this line numerous times in the past, and this time could be no different from the past, ending in a rebound instead of a breakout. If the breakout doesn’t […]

Hong Kong 50 Index approaching resistance of a Rising Wedge
Hong Kong 50 Index is approaching the resistance line of a Rising Wedge. It has touched this line numerous times in the last 2 days. If it tests this line again, it should do so in the next 5 hours.